Horse owners have to make informed decisions every day about their horses’ diets, exercise, training, socialization, and health care.
By Chloe Campbell
At the 19th International Society for Equitation Science Conference, Iris Huisman from Wageningen University in the Netherlands presented research on the significant environmental impacts of sport horses, focusing on greenhouse gas emissions and their lifecycle footprint.
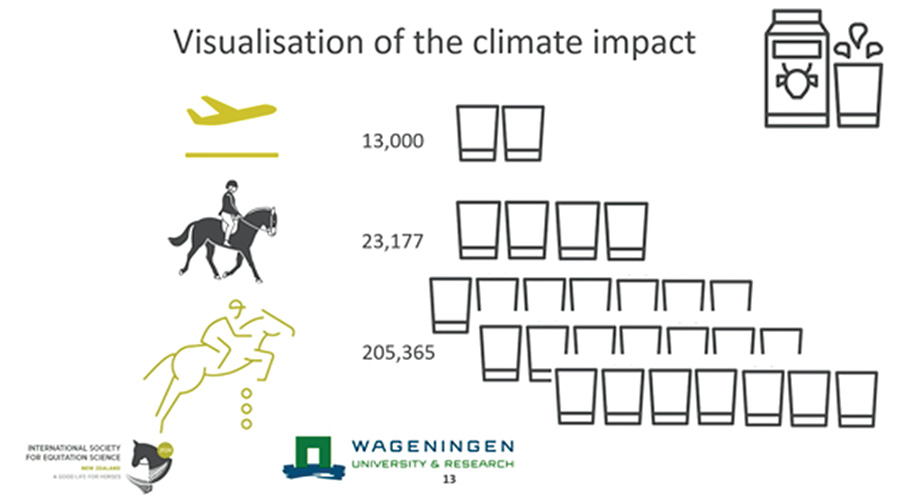
This research was requested by the European Equestrian Federation and researchers Iris Huisman MSc, Theun Vellinga MSc, Dr Karin Groenestein, and Dr Hassan Pishgar Komleh explored the significant environmental impacts of sport horses, with a primary focus on greenhouse gas (GHG) emissions. This research comes with a mix of feelings, as Huisman acknowledged the irony of flying halfway across the world to give her presentation at the ISES New Zealand Conference, contributing approximately 3,500 kg of carbon dioxide, equivalent to the emissions from producing 13,000 glasses of milk (Fig 1).
Understanding Greenhouse Gas Emissions
Greenhouse gas emissions, expressed in carbon dioxide equivalents (CO2-eq), measure the total emissions contributing to a carbon footprint of a given activity. The primary sources of GHG emissions in equine operations include:
• Carbon dioxide (CO2): Emitted from fossil fuel burning and deforestation for feed production.
• Methane (CH4): Produced during hindgut fermentation in horses and from manure storage.
• Nitrous oxide (N2O): Released from the fertilisation of feed crops and manure management.
Each gas's impact is measured in terms of its global warming potential (GWP), with methane having a GWP of 34, meaning it has 34 times the warming potential of CO₂, and nitrous oxide a GWP of 298 indicating it has 298 times the warming potential of CO₂. Therefore, these gases are significantly more potent than carbon dioxide in terms of warming potential.
Life Cycle Assessment: The Hoofprint Model
The researchers utilised Life Cycle Assessment (LCA) to evaluate the environmental impact of sport horses. The LCA is a method that calculates the carbon footprint (CFP) of products, services or processes by considering all stages in the lifecycle. For sport horses, this assessment goes beyond the farm gate to include transportation for competitions.
The Hoofprint Model specifically analyses sport horses. It considers:
• Reproduction: Inputs of feed and resources for mares, stallions and foals, along with associated GHG emissions.
• Raising Young Horses: Inputs for young horses (mares, geldings and stallions) and resulting emissions.
• Sport Horses: Inputs for trained competition horses and their emissions.
• The Functional Unit (FU) in this study was defined as per horse per year.
Model Components
The Hoofprint Model comprises various modules:
• Herd Module
• Nutrition Module
• Feed Module
• Activity Module
• Emissions Module
Data
Inputs included data on feed, training, manure management and travel. The model was applied to a non-Olympic year, using data from FEI dressage schedules (truck travel only) and the Global Champions Tour (truck transportation and intercontinental flights).
Results: Greenhouse Gas Emissions
• Without Transport: Emissions were similar for jumping and dressage horses from ages 5 to 12, with only slight dietary differences.
• With Transport: Jumping horses exhibited significantly higher emissions due to flights. By age 12, a jumping horse's emissions reached 400,000 kg CO2-eq, while a dressage horse's emissions were 6,000 kg CO2-eq.
Results: Hotspot Analysis
• 1-Year-Old Horse: Most emissions came from feed production (49%), followed by manure management (35%) and hindgut fermentation (16%).
• 12-Year-Old Jumping Horse: Emissions were dominated by transport (92%), followed by feed production (5%), manure management (2%) and hindgut fermentation (1%).
Huisman states “In the 12-year-old jumping horse, CO2 emissions being dominated by transport doesn’t mean all of the others are not important anymore, feed production is still very relevant”.
Discussion Points
• Differences in CFP: There is a significant contrast between the carbon footprints of dressage and jumping horses.
• Human Athlete Travel: Like equine athletes, human athletes and spectators also contribute to GHG emissions through travel.
• Health Implications: Travel can impact horse health and wellbeing.
• Climate Impact: Climate change affects sports, necessitating travel which in turn contributes to climate change.
• Travel to conference: Equivalent to 13,000 glasses of milk produced (see Fig 1)
• Dressage Horse: Equivalent to 23,177 glasses of milk produced.
• Jumping Horse: Equivalent to 205,365 glasses of milk produced.

Figure 1: Visualisation from Huisman of CO2 emissions demonstrating how the emissions from travel and sport horses are comparable to the carbon footprint of producing glasses of milk.
Huisman stated “The results depend heavily on the types and amounts of feeding ingredients used. Different countries may have varying feed compositions and practices, which would affect the overall GHG emissions. For instance, the Netherlands might use different grains or forages compared to the US or Australia, leading to variations in the carbon footprint… we used a comprehensive feed database that accounts for all emissions produced per feedstuff”
Conclusions
Different GHG sources play roles in the overall emissions of sport horses, with transport having a substantial impact on the carbon footprint.
This comprehensive analysis underscores the need for continued research and potential changes in management practices to mitigate the environmental impact of sport horses.
Source: International Society for Equitation Science


